Market Returns and Regression Betas →
In a previous post we saw how volatile a stock is, compared to a broader market performance, by plotting the percentage change in weekly returns of the stock prices. We were able to visually see that a certain stock was moving much more vigorously than the market (S&P 500 in that case).
In this post, I want to see how to find and measure the movement of a particular stock with respect to the market. Is there a standardized measure? Suppose an investor who holds multiple assets wants to measure how much risk a particular asset adds to his portfolio, is there a way he can quantify the risk?
Statistically, covariance of an asset measures how much the asset moves compared to market movements
Beta is a standardized measure of this covariance.
        covariance of asset with market
Beta =  ---------------------------------
            variance of the market
Since we have market returns data that we used in our previous plot, we can run a regression on this data and try to fit a straight line to the data points in our dataset. The slope of the regression is the Beta.
R_asset = alpha + beta * R_market
Let us use the statsmodels library to compute a linear regression.
import statsmodels.api as sm
...
x = sp500_returns
y = nvda_returns
x = sm.add_constant(x)
nvda_reg = sm.OLS(endog=y, exog=x)
nvda_reg_model = nvda_reg.fit()
print(nvda_reg_model.summary())
OLS Regression Results
==============================================================================
Dep. Variable: Adj Close R-squared: 0.265
Model: OLS Adj. R-squared: 0.262
Method: Least Squares F-statistic: 93.11
Prob (F-statistic): 5.21e-19
Log-Likelihood: 414.26
No. Observations: 260 AIC: -824.5
Df Residuals: 258 BIC: -817.4
Df Model: 1
Covariance Type: nonrobust
==============================================================================
coef std err t P>|t| [0.025 0.975]
------------------------------------------------------------------------------
const 0.0080 0.003 2.598 0.010 0.002 0.014
Adj Close 1.7961 0.186 9.649 0.000 1.430 2.163
==============================================================================
Omnibus: 73.992 Durbin-Watson: 2.085
Prob(Omnibus): 0.000 Jarque-Bera (JB): 639.151
Skew: 0.846 Prob(JB): 1.62e-139
Kurtosis: 10.492 Cond. No. 60.8
==============================================================================
Notes:
[1] Standard Errors assume that the covariance matrix of the errors is correctly specified.
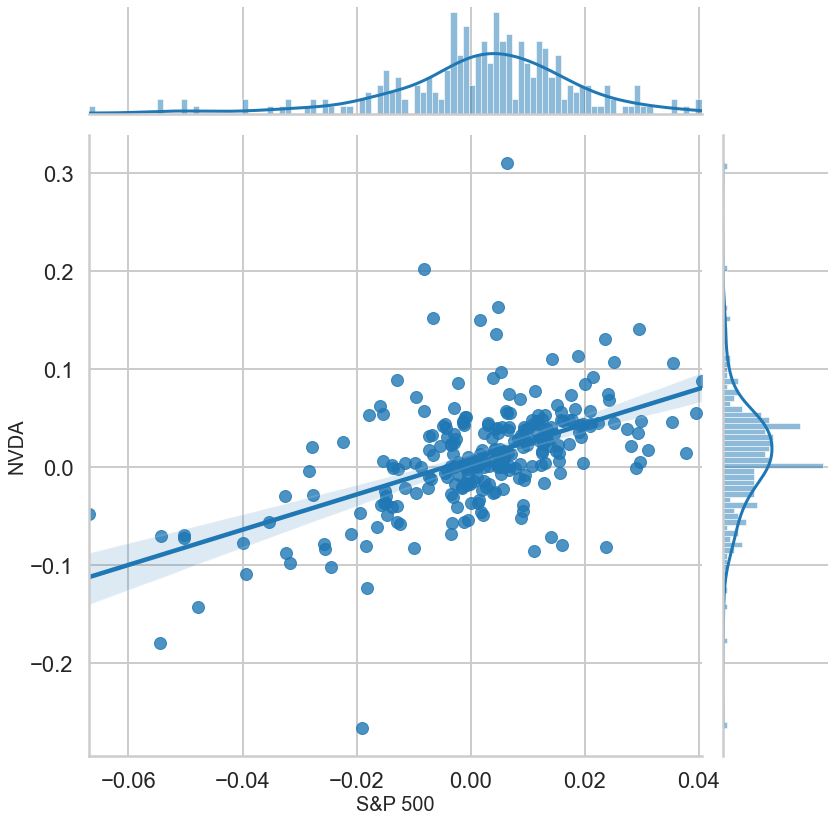
Since we used (percentage change in ) adjusted closing prices in our returns (with the column name ‘Adj Close’ in our dataframe), we see that the beta of NVIDIA stock during the period of the regression (2015-2019) is 1.79. We also see the R-squared value of our regression which turns out to be 0.265 and this indicates that 26.5% of the risk can be attributed to the market risk while the remaining 73.5% of the risk is firm specific. We also see the P value of our regression and a bunch of other details.
We can also plot our regression:
p = sns.jointplot(x = sp500_returns, y = nvda_returns,
                 kind = "reg", fit_reg=True,
                 height = 20,
                 marginal_kws = dict(bins=100))
...
If you are an investor and you are given a choice between two stocks having the same beta but very different R-squared - which one would you choose and why?