Market Returns and Stock Prices →
I recently started learning about stock prices, market returns and how risk is measured. I am still in the process of learning about it and I hope to add more to my knowledge in the following months.
There are many stock indices to look for how the general market is performing. More often, we hear about DOW index (DJIA - Dow Jones Industrial Average) down or NASDAQ up and so on. But NASDAQ is a technology firm heavy listing - i.e. the movement of the NASDAQ index would indicate the movement of technology sector to a large extent. While DJIA is a more general mix of stocks, it is price weighted and so companies with a higher stock price or extreme price movements would influence the movement more. Another common index is the S&P 500 (Standard and Poor’s 500) Index. S&P 500 is weighted by market value of the companies rather than the stock prices. So, a 5% movement of a $200 stock would affect the index the same way as a 5% movement of a $100 stock.
Let us see how the weekly percentage change in returns of one of the stocks (NVDA) compares to the percentage returns of the S&P 500 returns (usually referred to as market returns), over a period of about five years.
...
sp500_returns = sp500_df['Adj Close'].pct_change()[1:]
nvda_returns = nvda_df['Adj Close'].pct_change()[1:]
...
...
sp500_returns.plot(label='S&P 500')
nvda_returns.plot(label='NVDA')
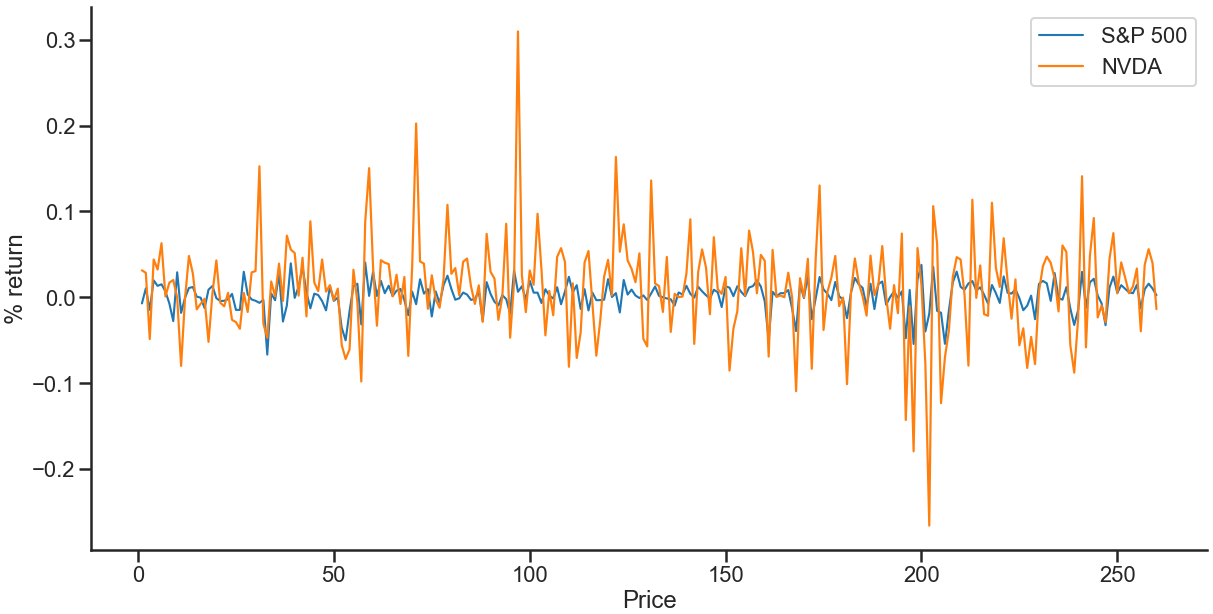
The above plot shows you how much NVDA (NVIDIA stock prices) fluctuate more than the general market (S&P 500 price index). If the stock is too volatile, it might be because of some risk associated with that stock, some portion of which can be explained by market movements and some portion specific to the company’s internal risk. Beta is typically used as a measure of risk, which we will compute in a future post.