Analyzing some more Pokemon data →
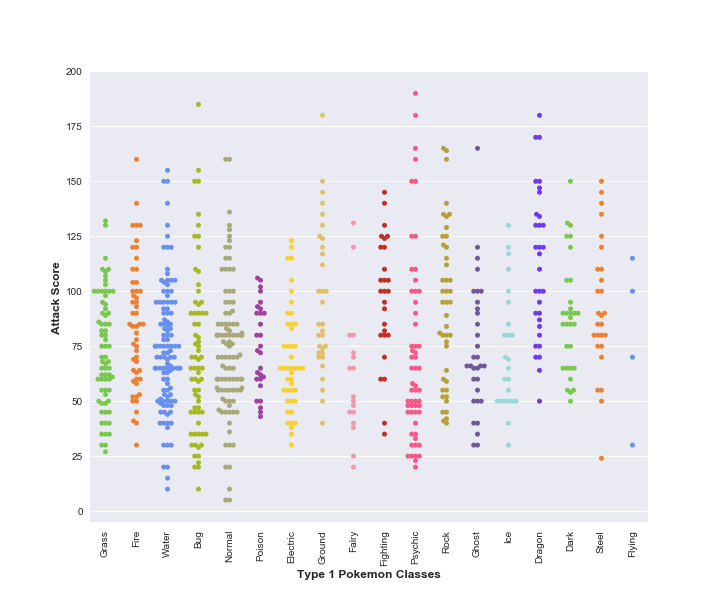
Let’s continue with our data from previous post and try to look at one more fancy function from the seaborn library. In particular, we will use seaborn’s swarmplot function to see how the Attack scores of Type-1 Pokemons of each Type-1 class are spread out. pokemon_colors is just an array of colours for different pokemon classes.
sns.swarmplot(x='Type 1', y='Attack', data=df,
              palette=pokemon_colors)
And here’s the result: