What have people been watching on YouTube? →
For more than 15 months people around the world are mostly staying indoors, those who could are working from home, vacations and other outdoor entertainments have come to a standstill. At the same time, NetFlix, gaming, and other entertainment like TV and YouTube must have become more popular - after all, these are the forms of indoor entertainment. I decided to look at what people have been interested within this limited set of entertainment avenues. While I could not find most data, YouTube data was available and regularly updated. I decided to download the dataset that contains YouTube data from August 2020 until early June 2021. Let us see what people (in the U.S.) have been watching on YouTube during this period.
yt_us = pd.read_csv('US_youtube_trending_data.csv')
yt_categories = pd.read_json('US_category_id.json')
yt_us.dtypes
The different features in the dataset are (after casting publishedAt and trending_date to datetime type):
video_id                          object
title                             object
publishedAt          datetime64[ns, UTC]
channelId                         object
channelTitle                      object
categoryId                        object
trending_date        datetime64[ns, UTC]
tags                              object
view_count                         int64
likes                              int64
dislikes                           int64
comment_count                      int64
thumbnail_link                    object
comments_disabled                   bool
ratings_disabled                    bool
description                       object
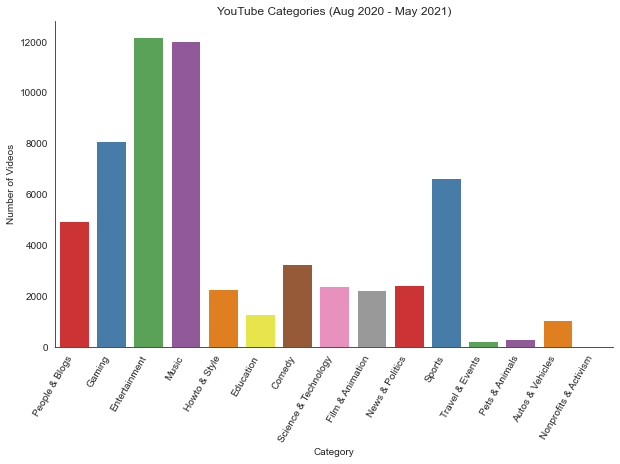
There are different categories of videos in the dataset, and these are the number of videos in each category.

I am surpised by the number of videos in some of the categories or the categorization itself. There is a category on People & Blogs - I am not sure what it refers to. I do know artists have their own channels and YouTube is a more lively form of a blog, but there is also Music (some of the channels there might also be by music artists). While I try and understand how the different videos are categorized, let us look at some other stats.
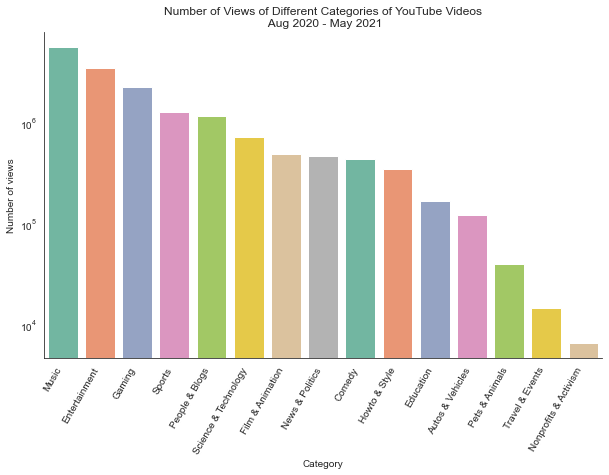
Let us find out how many aggregate views each of the different categories has:
cat_view_count_df = yt_us.groupby(['categoryId'])['view_count'].agg(['sum'])

chart = sns.barplot(
        data=cat_view_count_df,
        x='categoryId',
        y='view_count',
        palette='Set2',
        order=cat_view_count_df.sort_values('view_count', ascending=False).category
)

Not surprisingly, Music, Entertainment and Gaming are right at the top. Unfortunately, Education category is way behind. I find YouTube as a wonderful source of education. But may be this is due to Coursera, Udacity, etc. having their own video encoders and decoders and do not have their content on YouTube.
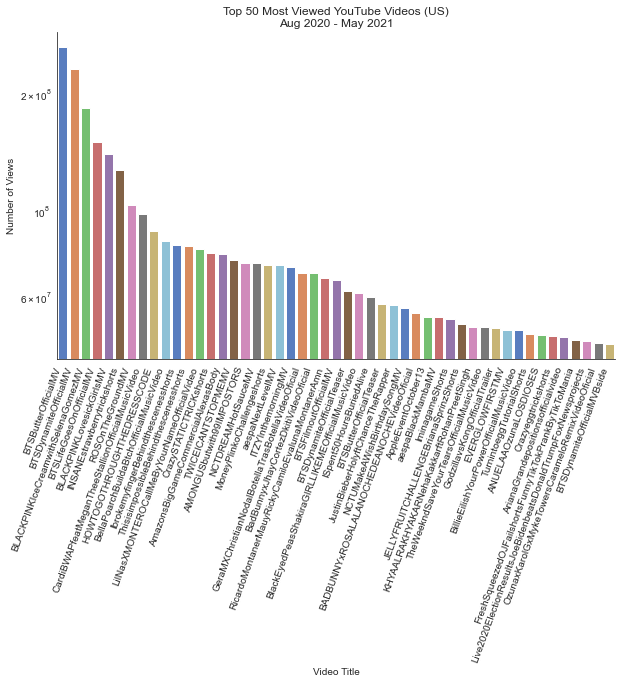
Let us see which were the Top 50 most viewed videos during the time period, in the U.S.
# create a new column 'count_max_view' to collect max view_count
yt_us['count_max_view'] = yt_us.groupby(['video_id'])['view_count'].transform(max)
# sort the column so that we can pick out the top 50
top50 = yt_us[yt_us['view_count'] == yt_us['count_max_view']].sort_values(by=['count_max_view'],
                                                                          ascending=False).head(50)
# remove non alpha-numeric characters from the titles
top50.title = top50.title.str.replace('[^a-zA-Z0-9]', '')
And let us plot the dataset to see which ones are on the top:
fig = sns.catplot(
            data=top50,
            x='title',
            y='view_count',
            kind='bar',
            palette='muted',
            aspect=2,
            legend=False
)

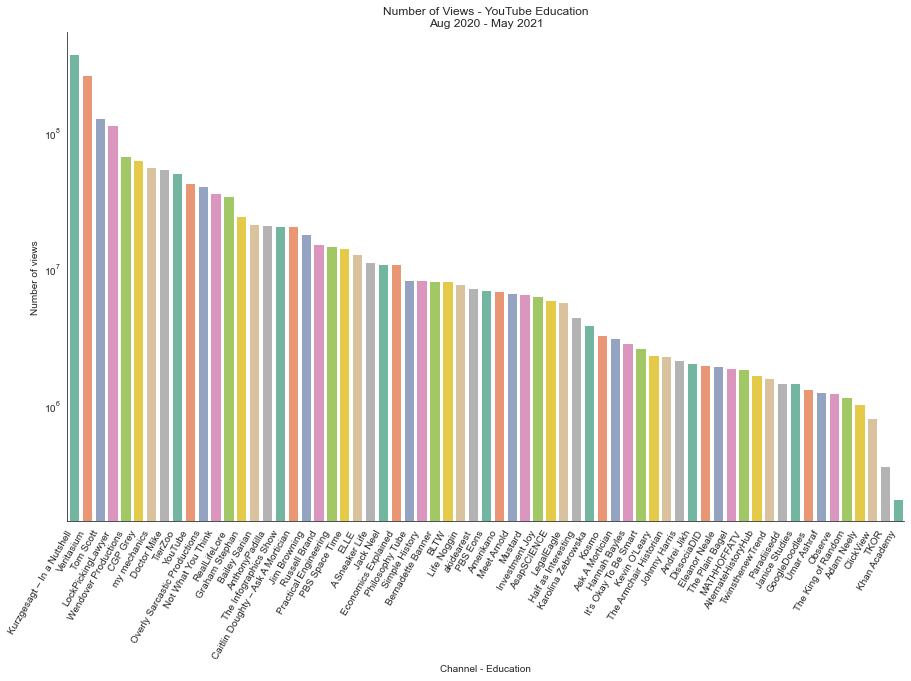
Since I am fond of Education, I would like to see which YouTube channels have maxinum number of views and check if any of my favourite channels appear in the list.
yt_edu = yt_us[yt_us['categoryId'] == 'Education']
yt_edu = yt_edu.groupby(['channelTitle'])['view_count'].agg(['sum'])
chart = sns.barplot(
        data=yt_edu,
        x='channelTitle',
        y='view_count',
        palette='Set2',
        order=yt_edu.sort_values('view_count', ascending=False).channelTitle
)

I see a lot of interesting channels - Khan Academy seems to have just made it to the list. I also see a channel YouTube. I see lots of interesting channel names and I hope to spend more time exploring those on YouTube very soon.
The YouTube dataset is also available for other geographies. Someday, I would like to compare how the interests in different geographies differ by comparing YouTube channels’ popularity. It may not be an accurate representation of interests at all, but it should be a fun exercise.