TSLA joins S&P 500 →
A week ago Tesla Motors (TSLA) joined the S&P 500 Index - the stock market index that keeps track of the performance of 500 largest companies listed in stock markets in the US. Overall TSLA has been very volatile - many argue that the volatility (risk) indicates the opportunies for Tesla. Now that we are towards the end of the year, a pandemic year, let’s see how the S&P 500 performed and how Tesla performed.
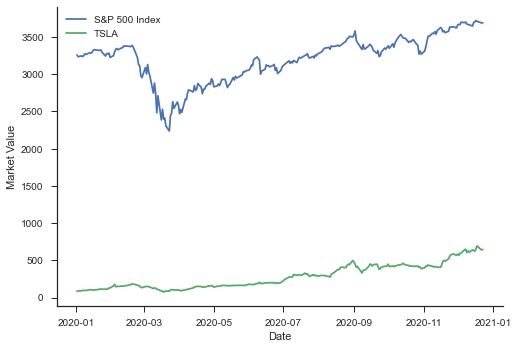
And in terms of the value of TSLA stock and S&P 500 Index, this is how they fared during this year:
tsla_df = pdr.get_data_yahoo("TSLA",
                              start="2010-07-01",
                              end="2020-12-20",
                              interval="wk")
...
...
plt.plot(snp_df['Date'], snp_df['Adj Close'],label='S&P')
plt.plot(tsla_df['Date'], tsla_df['Adj Close'], label='TSLA')
plt.xlabel('Date')
plt.ylabel('Market Value')
...
...
All the data was collected using pandas_datareader and the plots done using seaborn library.