Let's play with some Pokemon data - 1 →
Let’s take a small break from OCaml and recursion and learn some data analysis. For this purpose, I am using python and a couple of libraries like Pandas, Numpy and Matplotlib, which will help us in preprocessing the data, some numerical data-types as well as plotting the data, respectively. In future posts, we will see more such awesome libraries.
For this post, let’s just focus on a Pokemon dataset that I happened to come across in Kaggle. Although I have never played Pokemon and never knew the different Pokemon characters, this is a nice simple example to get us started.
You may want to install python - I personally like Anaconda because it offers a wonderful platform with code editor as well as a console for visualization, etc., which makes it easy to play around and learn. I installed Anaconda and use their development environment Spyder.
Let’s get started right away. First, we import the libraries we will use for this short tutorial.
import pandas as pd
import numpy as np
import matplotlib.pyplot as plt
We will use these libraries only very minimally for this short post, but they are very powerful and we will see more of their features in future posts. If you create a (free) account in Kaggle, you can download the Pokemon dataset. I have downloaded it and saved it in a file named Pokemon.csv. We will use Pandas read_csv function to read the downloaded csv file.
pokemon_data = pd.read_csv('Pokemon.csv')We will call it pokemon_data. Pandas refers to this type as a dataframe. If you look at the dataset the first column is just an index, so it’s useless for our analysis purposes. So we will go ahead and grab only the rest of the columns (and all the rows).
pokemon_data = pokemon_data.iloc[:, 1:13]Here [:, 1:13] says that “grab all the rows (denoted by :) and columns 1 to 13. Now, let’s explore the data a bit. It’s always a good idea to take a quick look at the dataset to see what are the different columns and what kinds of values or informations they indicate about the dataset. In this case, I see that there’s a column called Generation and it seems to take values between 1 and 6. Probably there are six generations of Pokemons, at least to my understanding. Now, let’s try to see how many Pokemons are there in each generation. If it were a population dataset, this is analogous to finding out how many people are in each continent, or something like that. I will call the number of generations by the variable no_gens. We need to pick the column named Generation and count the number of unique entries. Since there are 800 Pokemons in all and they belong to one of the 6 generations, there will be multiple rows that contain the same value for Generation and hence we need to find the number of unique values (which after having a quick look at the dataset we know is 6, but it is always better to confirm algorithmically and store in a variable). We achieve this by the function unique() applying it on the column. We extract the specific column by using the column label, in this case Generation. Similarly we count the number of values in each generation using the function value_counts()
no_gens = pokemon_data['Generation'].unique()
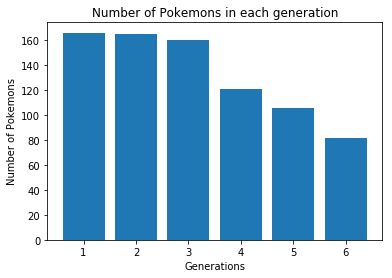
count_per_gen = pokemon_data['Generation'].value_counts()Let’s try to plot the above values to have a better visual representation. I will use matplotlib’s pyplot library utilities for this purpose. It is very simple and intuitive to use. We will plot a bar chart - so we need to find out the values for x and y axes. Let’s first label the plot and the axes.
plt.xlabel('Generations')
plt.ylabel('Number of Pokemons')
plt.title('Number of Pokemons of each generation')
plt.bar(no_gens, count_per_gen)
This would result in a plot as shown below:
That was pretty quick. Let me stop here and let you all digest the information presented. We will analyze the Pokemon dataset more in the coming posts.