-
Opportunities in Metaverse →
A previous post outlined several drivers of metaverse. While it is still in its nascent stages, metaverse would bring truly immersive environments whose applications would span beyond video games. With the trends in virtual and augmented reality, there are immense economic opportunities as well as implications.
Gaming: The most widely accepted and widely talked about application is, of course, gaming. Game developers have been creating virtual worlds for decades - so what is different now?. With advances in hardware accleration and Deep Learning algorithms, virtual world experience is becoming more and more realistic than in previous generations of games. For example, techniques like real-time ray tracing were known for a very long time. These are beginning to become practical and a commonplace only recently. So are techniques like super sampling techniques using Deep Learning, as well as other compression techniques that enable creating Bounding Volume Hierarchies (BVH) packing more details about the scene. With Deep Learning techniques playing an increasing important role in simulating physics, more interactive and immersive games can be developed that generate close to accurate physics (flames, movement, flow, etc.) making graphics more realistic. There is enough economic opportunity in gaming and with game streaming it has been growing at an accelerated pace. One can check out the Twitch Streaming Statistics and get convinced.
Advertising: If I am watching a live sports event on TV (like soccer) from San Francisco, I would see advertisements pertaining to the local (US) market, while the same game, in an Italian feed, will have advertisements tailored to the European market. This is already a well-known and mature technology called virtual replacement perimeter technology. Supponor is one of the leaders in this space. Metaverse would enable to take this a step further. The commercials would not only get specialized or tailored according to the local market where it is being broadcasted live but also according to each viewer’s personal preferences. Much like how Google’s digital advertising and the growth of mobile and social networks allowed personalized, targeted ads, metaverse would offer such opportunities in a more immersive arena. Technologies pioneered by companies like Mirriad for product placement would be extremely valuable and amenable to personalization, not just for live concerts and live sports but many varieties of content created for the metaverse. Of course, there needs to be sufficient guard-rails and transparency and there would also be renewed debates on native advertising.
Factory Automation: Like gaming, this is one of the other avenues being talked about. There is one major difference between the virtual world (metaverse) created for gaming and the one created for factory automation purposes. For gaming, the artifacts that make up the metaverse is completely upto the imagination of the creator. However, in the case of factory automation, the digital twin has to replicate a physical structure that already exists. Any change in structure or function created (imagine the direction of conveyor belt in an assembly line) in the physical world has to be reflected in the digital twin. There is also less freedom on what artifacts could to be in the digital twin (metaverse). If many factories have identical assembly lines (like many traditional automobile factories or soft-drink bottling units, etc.) one could work with a templated setup. This would involve creating the artifacts common to all these templates (using Graphics SW tools, videos of factory, AI, etc,.). Further even if many factories share common templated factory floors at a high-level, there might be efficiencies that are introduced at the micro level (kinds of robot-arms they use, kinds of automated inspection mechanisms, etc,.) and these would be the key differentiators leading to competitive advantage. There might be commodity goods made by manufacturers who have no apparent competitive advantage over other similar manufacturers (think of zippers, nails, bottle-caps, automotive brakes and lately some semiconductor components, etc,.) for whom creating a digital twin would be easier. But they are also the ones who would move slowly on such innovations as their business becomes more and more commoditized. On the other hand factories who have a great competitive advantage (in terms of operational efficiencies) can leapfrog by having a centralized view of global factories and bringing them all to the same efficient mode.
E-commerce: Advances in technologies like photogrammetry and depth-sensing cameras becoming a commonplace in most smartphones can bring about new innovations in e-commerce. Most of e-commerce today is centered around purchase based on reviews from trying the product offline. It becomes interesting when purchases of clothes and accessories are made as one has to trust the size, fit, etc,. Customers tend to purchase multiple sizes only to return some of them back. Though many never realize, the returns in brick-and-mortar stores is around 8-9% while online retailers can see as much as 30% of the products returned. It runs to billions of dollars worth of merchandise. Virtual trial rooms could pop up at many points of interests (shopping malls, cinemas, etc.) or even in your living room (using a VR head-set and a phone camera or a Kinect system) that would allow one to try out new clothes. It could be tied to other marketing avenues (cross-selling) like selecting a design from a fashion show or a TV series and trying them as and when watching those shows.
High-end fashion is already experimenting with augmented reality. Who doesn’t want to go watch virtual French Open sitting next to friends from around the world while wearing your favorite Rafa Nike virutal t-shirt having the Raging Bull logo? Merchandises are already common in many video games and it could seamlessly get into fashion and other virutal events. Given the growth in influencer economy, it would also be an innovative way for amateur fashion designers to showcase their designs and their brand.
Healthcare and Bio-informatics: Over the last decade, we have seen increased adoption of robotic surgery - devices like DaVinci systems have been installed in several hospitals around the globe as it minimizes direct human contact during surgery and reduces infection rates. However, Da Vinci is a robotic arm controlled by a skilled surgeon along with mounted cameras and associated image processing software. With decreasing cost of sensors and advancements in software, a sophisticated array of sensors attached to the robotic arm could provide vital information overlaid (augmented reality) on the camera images of the surgery would provide real-time information that could aid in real-time and critical decision making. With advancements in 5G and networking bandwidths, Da Vinci like systems could one day make remote surgeries possible. Here’s where metaverse systems could play a huge role. Effectively collaborating with different expert surgeons connected to the robotic arm from different parts of the globe would require the image processing software to be capable of showing different views, different sets of vital information in real-time to different surgical experts and also keep each of the surgeons informed of what the other surgeon is trying to do. This requires a lot of image processing, processing data from different sensors in real-time, syncronizing the views of different surgeons and doing it all in real-time. Technologies such as these would also play a vital role in medical education, to train more professionals in places where such high-end technologies may not be very common.
MRI is another evolving technology with more and more software components, especially image fusion and augmented reality components, along with advances in physics. There is a very nice explanation of MRI in Canon’s webpage. A keen observer would be able to already notice the various places where imaging technology could be improved many folds using techniques like DLSS and the like. Image processing applications in a plethora of fields are getting better using Deep Learning techniques, including such medical imaging systems.
Research in genome sequencing has advanced leaps and bounds over the last decade. Whole genome sequencing (WGS) analyses developed using systems like Illumina provide a high-resolution base-by-base view of the genome. Softwares like TruSight combine the features used by different experts all in one dashboard and provide several ways of visualization and analysis. Softwares like these are testament to the convergence of hardware, system software, graphics and image processing and collaboration softwares as well as techniques like machine learning, all of which are required for research in areas like bio-informatics. With metaverse like platforms many experts can tap into the same analysis done in one molecular biology lab, and can sort them in different ways depending on the remote biologist’s expertise. While one might be an expert in variant filtering, the other might be an expert in evidence retrieval.
Fitness and Active Sports:
Though technologies in fitness got a big boost during the pandemic, mostly due to the interest in exercise equipments like Peloton bikes, sports science has been an active field of research by many global brands like Nike. Companies like Google have already mapped the many streets of the world, with popular places having more detailed maps. It would be great to integrate this information with a AR/VR headset that would allow one to do Giro d’Italia right from one’s living room on a stationary bike. It could even be possible for me to go on a ride with my friends (all of whom are in their stationary bikes probably in their living rooms or patios in different parts of the world), while turning around to talk to them or turning back to check on a slower rider. These require enormous graphics processing power (enabled by GPUs) combined with image processing software (enabled by AI) and a high bandwidth internet connectivity (enabled by 5G). For sports physicians, trainers and training apps this would also enable to monitor their customer’s vital information in real-time as and when they are working out and provide corrective information and guidance.
There are several business opportunities in the metaverse and several more would emerge. There are several challenges, especially around security of such systems. The success would however down to the right business model as well as focussed, deliberate execution. We might still see several companies getting on the metaverse bandwagon as did several newspaper companies thought internet was just about creating a website without understanding the distribution and personalization powers of the internet. There would be several “me-too” businesses trying to ride the “metaverse hype” without a sustainable business model, while a few who are deliberate would turn out to be the Amazons and Googles of the next decade.
-
Metaverse and its Drivers →
Lately, we have been hearing a lot about the metaverse. Although this concept is not new, it has been brought to the limelight because of the huge bets and brand name changes from the potential big players in this space. However, the metaverse that is talked about today is different from what the current state of the internet offers and there are some key technological developments that are drivers of the metaverse and different companies are equipped with different strengths in order to join the competition.
Avatars and game environments have been around for quite some time, especially in immersive video games. The metaverse is much more than avatars or fancy immersive experiences as in video games. It is a platform, rather than a stand-alone application. It is a platform where several applications can be plugged in and get the benefits of the platform. This might be one of the probable reasons a social media messaging company recently rebranded itself. The new brand could mean a platform much bigger than social media, where social media would be just one of the components that could be plugged in. The metaverse combines AR (Augmented Reality) with communication and collaboration tools and in some cases with the help of VR (Virtual Reality) that results in an immersive, photorealistic communication, collaboration and entertainment experience. Many technological developments that happened over the course of the last decade are key to the big bets on the possibilities of metaverse.
The main technological advancements could be grouped under the following categories.
Graphics Hardware (Semiconductors) Computer processors have not just packed more and more transistors but the capabilities of graphics hardware have grown by leaps and bounds the last decade. The semiconductor process technology, new memory technologies, new functions and features driven by deep learning applications, real-time ray tracing, etc. have enabled a new era of computation possibilities at scale that until recently required expensive servers running over long periods of time in order to achieve the same computation. A big part of this is driven by semiconductor process technology (32nm in 2009 to 5nm in 2020) that enabled packing several transistors in a small area (of the die). Similar advances in memory technologies (3D stacked DRAM, advances in DDR as well as HBM and other new memory technologies) helped in increasing the on board storage by a large factor, as required by heavy graphics applications. Similar advances have also resulted in packing enough computation in small form factors like mobile phones, security cameras and other IoT devices. It has resulted in our ability to play games with a reasonably good graphics on our mobile phones. It has also enabled IoT devices to perform data analytics real time as and when they collect sensory data on the field.
Graphics Software (VR, AR, Photogrammetry, etc.)
If hardware was all that was needed, it would have been a commodity. The software layer brings in the innovation that software companies constantly compete to better each other at. For example, irrespective of intel or M1 processor the software layer should ensure that the applications work seamlessly across hardware configurations and operating systems. The more tied the hardware is to the software layer, more performance can be squeezed out of the hardware. Many of the graphics applications need a tremendous amount of compute power. This is especially true for photorealistic graphics. Even given the advances in semiconductors, especially graphics processing units, graphics software innovations require a mix of technology, science and art. While most software companies excel at technology, few excel in combining the three. Graphics components are relatively easy to create, but rendering photo-realistic graphics in real time in different form factors is not straight forward. Advances in AI techniques like Deep Learning Super Sampling (DLSS) and post-processing techniques like Temporal Anti-Aliasing (TAA) techniques have helped tremendously. Techniques like photogrammetry play a vital role in creating digital twins of artifacts, besides 3D cameras and effective and scalable stitching algorithms. AR also involves merging the physical world (camera sensed) augmented with layers of graphics content. Since motion of objects is the undoubted constant in all VR and AR experiences (as anyone who has watched YouTube 360 videos or played with an Oculus headset can attest), simulating physics is the next challenge to overcome. Simulating physics, beyond fire, waves and wind in Computer Graphics is a non-trivial task that requires simulating different materials like stones, marbles, snow, etc., besides their interactions with light rays (reflection, refraction, etc.) and rendering caustics. Although today’s graphics is a major leap from a decade ago, metaverse would demand a much higher quality of photorealistic real-time graphics.
Internet, 5G and streaming games
Metaverse has the potential to change collaboration and media consumption in ways internet changed marketing and commerce. The advances in the same technologies (web2.0, fiber optics, mobile internet, 3G, 4G) that propelled internet adoption would also catalyze technologies like metaverse. Over the last few decades, internet has completely transformed how we consume media content (streaming media, social media, etc. compared to print and television) and how we collaborate (Webex, Zoom, Google Docs, etc. compared to telephone calls and fax messages) increasing both efficiency and effectiveness. The internet infrastructure already being able to stream online games and movies and constantly improving bandwidth and connectivity, companies can safely bet on further improvements that would support applications in the metaverse. New and upcoming technologies like 5G would bring bandwidth intensive applications like gaming within reach for mobile consumers. As adoption increases there would be new opportunities for businesses with new and innovative business models emerging out of it, much in the same way internet created a wide array of marketplace business models (Amazon, Uber, Doordash, etc.). Many doubted Amazon’s and Microsoft’s potential at the beginning of the internet era. The companies that do not see the potential of the metaverse might get left behind when the potentials are realized by the leaders.
Social Networks
The current decade has seen an interesting growth in content creation. The growth of social media enabled everyone to interact and showcase their talent. Specifically, apps like Facebook, Twitter and TikTok made it possible for independent content creators and small businesses to reach and market their products and services effectively in a cost-efficient manner. Gaming is inherently a social activity. The more immersive or innovative games are, the more attention they get (e.g. Pokemon Go). When we think about it, there are many activities like movies, theatre, live sports, education, etc. that are also social activities, or at least the experience is enriched a lot when done as a social activity. Metaverse could offer these activities in the virtual world - for example, right from your living room in Singapore, you could watch US open, sitting in front-row seats at Arthur Ashe stadium, wearing your VR headset sitting next your close friend who is wearing another VR headset and is sitting in his living room in Sydney. Though we might be inclined to think that popular social media players would have an advantage in metaverse, we could also see new innovative players who could change the game. The bottom line is that for many of these social activities, metaverse would offer a much richer experience than what the current internet offers.
There are many other drivers that might directly or indirectly influence the adoption like enterprise communication and collaboration applications like WebEx or Zoom extended to factory floors rather than just computer screens, virtual tourism and adventure trips, etc. It is difficult to predict if metaverse would succeed but it is definitely going to bring lots of innovations in immersive graphics, simulation as well as hardware architectures.
-
Stories in Charts →
In this post, we will see the most ubiquitous, most useful and also the most easily mis-interpreted data visualization tools - charts. They come in various forms and they are used to represent different aspects of the underlying data. The key assumption is that the visual representation is easier to interpret quickly than in a tabular format. More often, one kind of story a chart conveys might hide another kind of story a different chart, of the underlying dataset, might have conveyed. It is not uncommon to find that the reader would interpret the chart in a way different from what the writer wanted to convey, in which case it is best for the writer to clarify the message being driven.
For example, let us look at the latest global vaccination data. When you look at the per-capita vaccination rates of different countries, and say you pick the top 50 countries, you would see a chart similar to the following (the chart below is from September, 2021). More specifically, the chart shows the number of fully vaccinated people per hundred of the population.
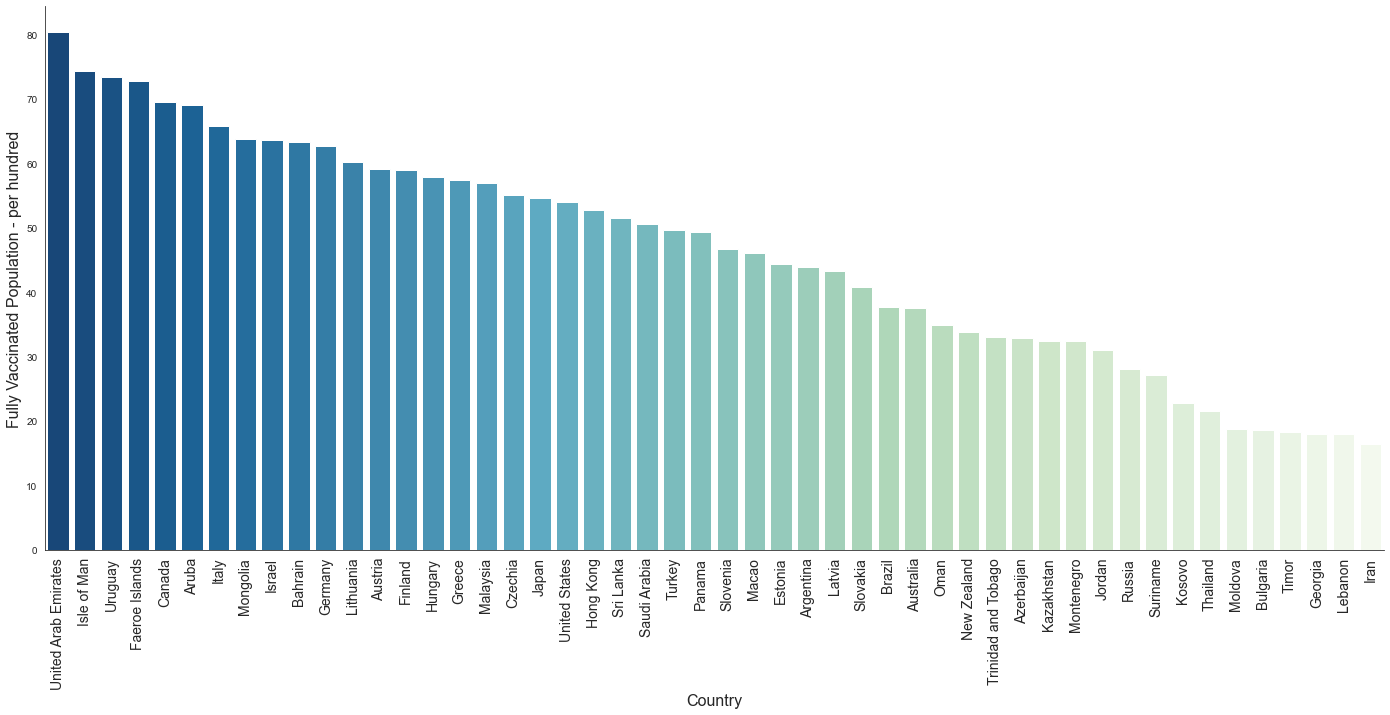
What story does this tell? While per-capita numbers are a way to normalize the data, it crucially depends on the story that one wants to tell. Does this indicate the ease of availability of vaccines? Does it indicate the effectiveness of the healthcare system? Does this indicate the willingness of people to get the vaccine? Or something else?
Let us look at the absolute numbers for the same data and look at the chart.
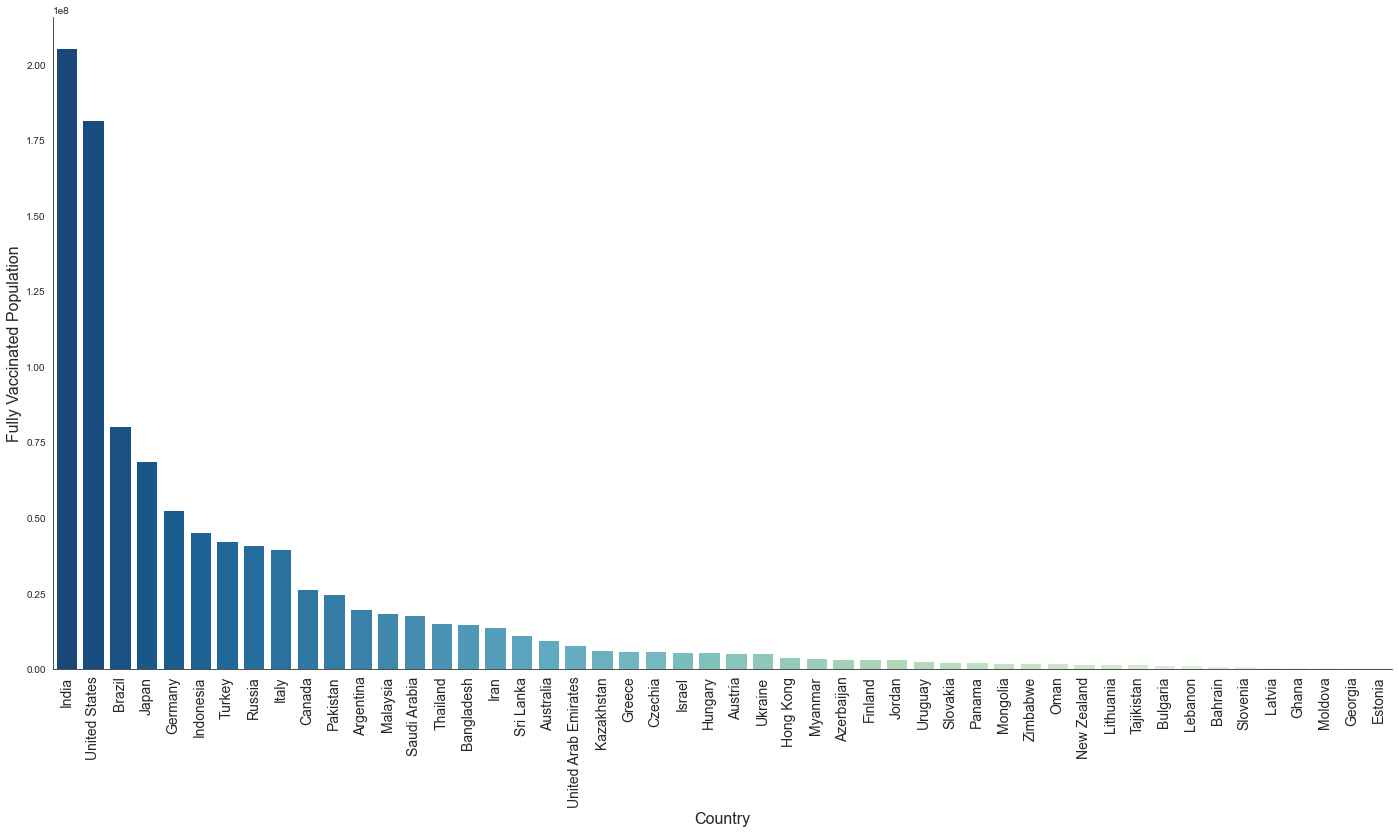
Data regarding fully vaccinated population from China was missing from the dataset and hence it does not show up in the chart. China had the most fully vaccinated population (absolute numbers) in September, 2021.
We see a different picture. What story does this tell?
While both of the above charts convey useful information, it is necessary to understand what useful story could be told using the above. For example, the first chart (per-capita) could indicate what percentage of the total population is vaccinated. This could indicate to what extent the spread of the virus or hospitalizations could be contained and that very likely these countries could get out of the pandemic sooner and become safer to travel to. It does not indicate the effectiveness of the healthcare system or the challenges in getting more people vaccinated, etc.
The second chart shows the absolute number of people vaccinated in many countries. The difference between the two charts could show the challenges in getting the population vaccinated - it could be geographical as in some countries might be too large posing a logistics challenge, it could be the size of the population - even if enough vaccines are in supply more would be needed to get the entire population vaccinated or it could be a short supply of vaccines - again because of lack of storage or the price or a weak healthcare infrastructure.
On similar lines, when you look at GDP data and plot the top 50 countries by GDP the chart looks something like the following.
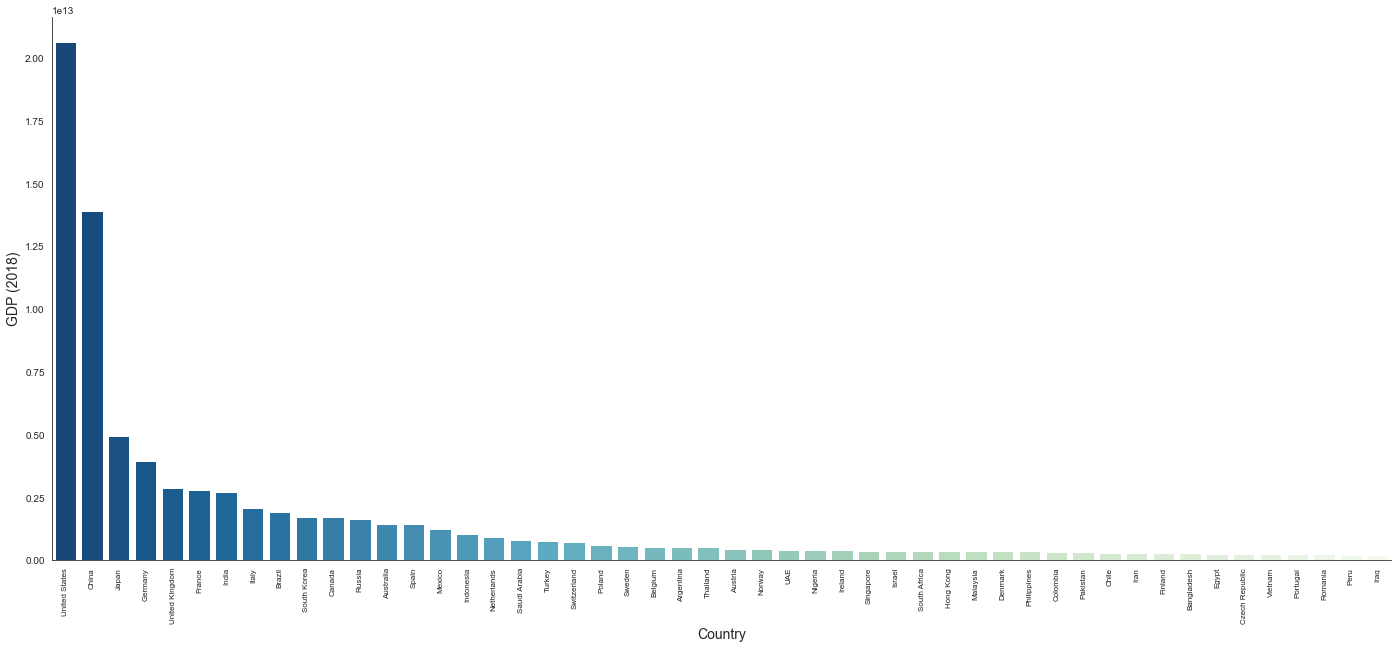
The GDP numbers are from 2018 rather than latest numbers in order to avoid the variations of the effects of the pandemic on GDP.
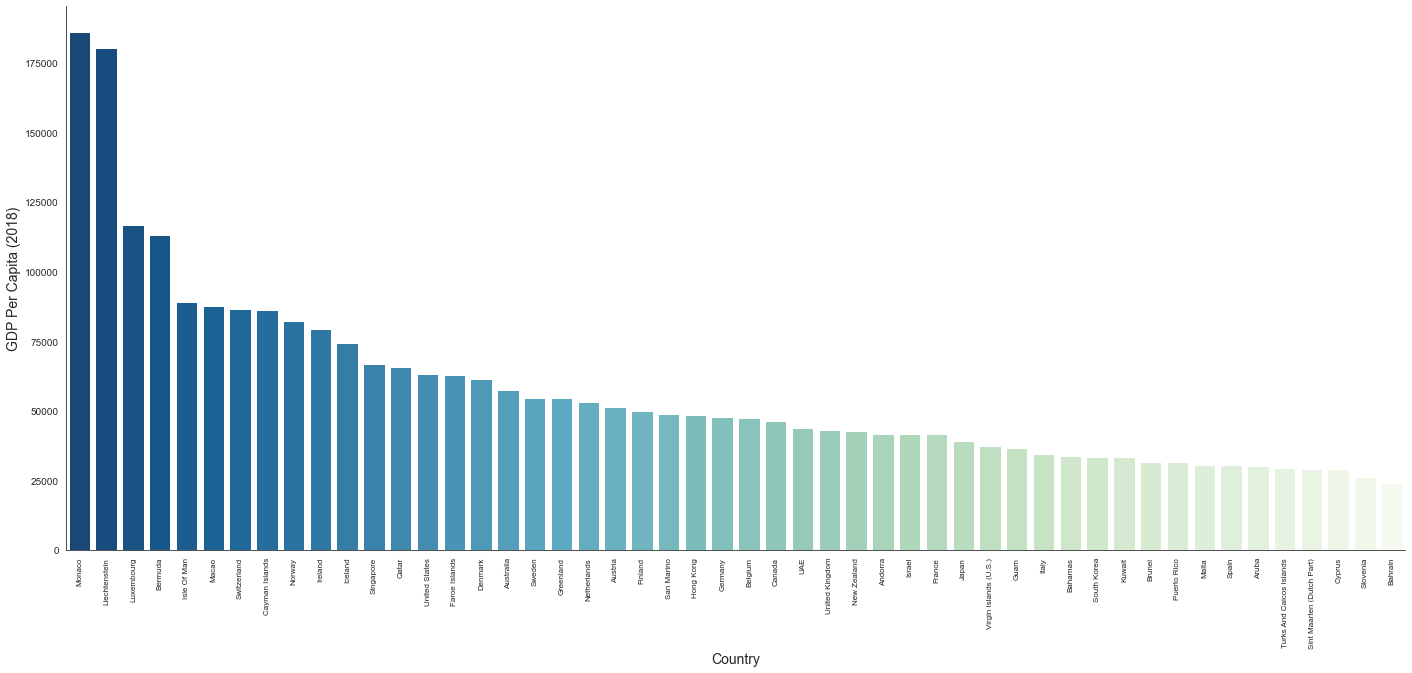
It shows the wealthiest countries (in terms of GDP). But does the wealth trickle down to every individual? Again, there might be challenges like population, management of funds, etc. Once you look at per-capita numbers one could see how different countries fare.
When you look at the GDP growth rate, it tells a different story - the countries that are improving from their past year. Yes, Libya did have 15% GDP growth in 2018.
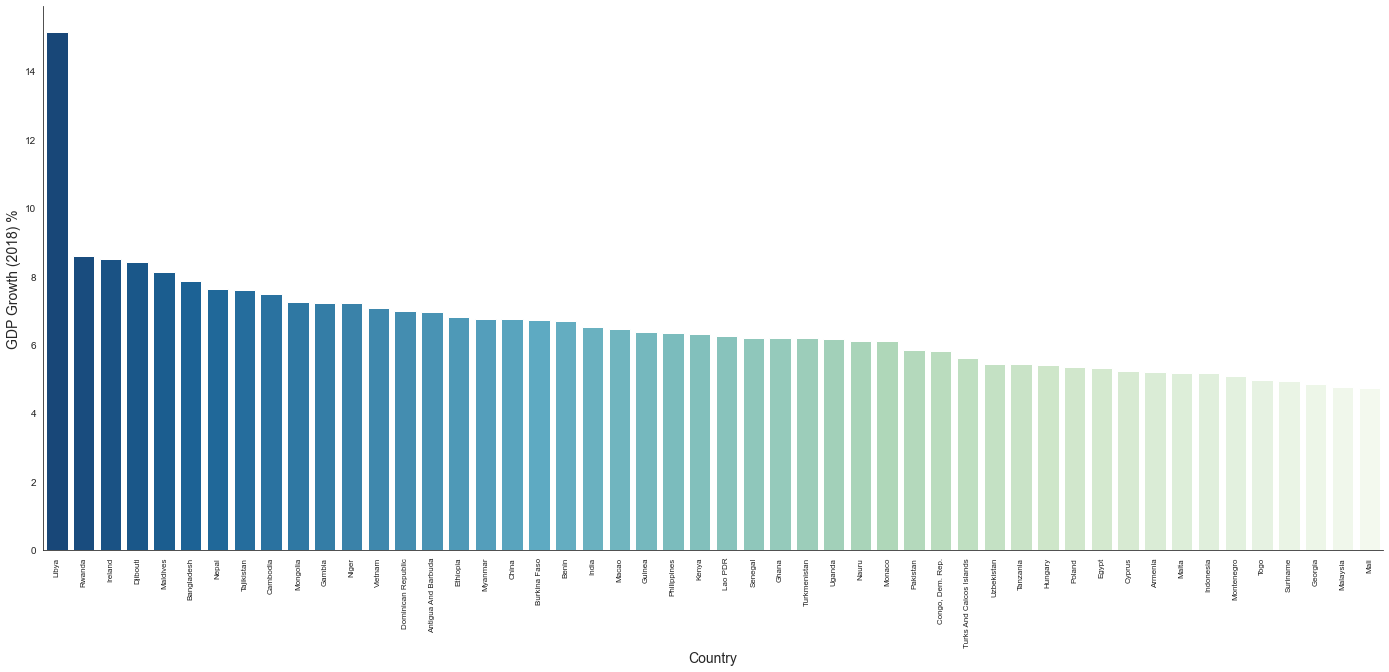
The chart we choose should depend on the story we want to tell. It is imperative to explicitly explain the choice of chart and how it tells the story the writer wants to tell and also the stories it does not.
The vaccination data used here is from a Kaggle dataset.
-
The Stories of Summer Olympics →
This is about the stories of Summer Olympics - not just one story but many stories and not just the recently concluded Tokyo Olympics, but all of the Olympic games since the first one in Athens in 1896. Although the analysis of the medals won by different countries would make the story read like a story medals and achievements statistics, there are other stories hidden within. We will narrate many of those as we do the analysis.
We will use
pandaslibrary to do the data analysis and plotly to create our plots that would tell a visual story.import pandas as pd import plotly.express as pxWhen we look at the hosts we see many western powers with Brazil and China (then emerging economies) hosting in 2008 and 2016 respectively. Of course, hosting an Olympics is no small thing - the infrastructure, safety, accessibility, etc. play a huge role and many of these cost money. London seems to be the only city that has hosted Olympics thrice.
total_medals_by_host_city = summer_df.groupby(['City', 'Year'], as_index=False)['Medal'].count()
fig = px.bar(total_medals_by_host_city, x='City', y='Medal',
            hover_data = ['Medal', 'Year'],
            color='Medal',
            title='Medals Awarded at Each Venue')
fig.add_annotation(x='London', y=1690,
        text="London has hosted Olympics thrice...",
        ...
        ...
        opacity=1.0
)
The number of events in each of the Olympics also seems to be different, as evidenced by the total number of medals awarded during the games. With Paris and London regularly competing for the best European City regularly I believe it is high time Paris got a chance to host the Summer Olympic games, and very glad 2024 Olympics are going to be held in Paris. I also hope more and more emerging economies to be able to host the games. The motivation and interest in sports such events would infuse is invaluable.
When we look at the cumulative number of medals won from the start of Summer Olympic games, USA clearly leads. But more important to note here is Russia which was more excellent in sports, science and technology, arts and culture, etc., when it was Soviet Union. Also interesting to note is the presence of an entry Individual athletes - athletes who chose to compete under the Olympic flag instead of any specific country. This is a political story.
total_medals_by_country = summer_df.groupby('Country', as_index=False)['Medal'].count()
fig = px.bar(total_medals_by_country, x='Country', y='Medal',
            hover_data = ['Medal'], color='Medal',
            title='Cumulative Number of Medals Won (1896-2021)')
There were many instances where athletes who requested to compete independently and were refused - for example, the ones who emigrated from Communist Europe during the cold war, as well as some during the 1976 Olympic boycott. The first provisions were made by IOC (International Olympic Committee) during the 1980 Summer Olympics hosted at Moscow.
When we look at the countries that shine on the top of the medals table regularly the familiar pattern is clear. It is mostly European countries, USA, Australia and more recently China. Although we might have cheered Usain Bolt’s sprints and track and field athletics being one of the most anticipated events of the Summer Olympic games, in terms of total number of medals, many western countries top the table year after year. This also indicates the broad variety and the number of events in the summer games.
There is also a political story hidden here, that of the 1980 Summer Olympics. There were only two cities that bid to host the games - Los Angeles and Moscow and eventually Moscow won. If you notice the 1980 Olympics that was hosted by Moscow, Russia seems to be the clear leader in terms of number of medals. Almost always, one expects host country to win several medals, but scoring more medals than the usual competitive powers is always a big achievement. Many nations boycotted the 1980 Olympics, led by the USA to protest against the Soviet-Afghan war. It had the smallest participation - just around 80 countries.
def top_n(n):
    return (
     df
    .groupby("Country")
    .agg({"Medal Count": "sum"})
    .sort_values("Medal Count", ascending=False)
    .head(n)
    )
df = summer_df.groupby(['Year', 'Country', 'Medal']).size().reset_index()
df.columns = ['Year', 'Country', 'Medal', 'Medal Count']
fig = px.bar(df.loc[df["Country"].isin(top_n(10).index)],
             x='Year', y='Medal Count',
            hover_data = ['Country', 'Medal Count', 'Medal'],
            color='Country', barmode='stack',
            color_continuous_scale=px.colors.sequential.Viridis,
            title='Medal Winners in Olympics')
There are more politics stories in Olympics. The apparent gaps in the plot below makes one wonder what happened those years. The 1916 summer Olympics, to be hosted by Berlin, were cancelled due to World War I, a first cancellation in the 20 year history of Olympics during those days. The 1940 Olympics to be hosted by Tokyo were rescheduled to be hosted by Finland (due to Japan’s invasion of China in 1937) and eventually cancelled due to the outbreak of World War II. Again, the 1944 Summer Olympics to be hosted by London got cancelled due to World War II. The 2020 Olympics hosted by Tokyo was rescheduled to 2021 due to the outbreak of Covid. It took tremendous courage and organization by Japan and the participating countries to put up a great show during the pandemic.
df_final = (df).fillna(0).sort_values(idcols)
                         .groupby(idcols[1:])
                         .cumsum()
                         .rename(columns={0: 'Cumulative Total Medals'})
                         .reset_index()
                         .merge(dfnoc, on='NOC')
Now, to finish it off, let us see how the top 25 medal winners (measured as per medals won in 2020) have fared over the years in terms of total medals won. The rise of China as a major sporting nation is very apparent.
fig = px.scatter(
    df_final.loc[df_final["Country"].isin(top_n(25).index)],
    x="Country",
    y="Cumulative Total Medals",
    log_y=True,
    size="Cumulative Total Medals",
    color_discrete_sequence=["brown","gold","silver"],
    color="Medal",
    animation_frame="Year",
    hover_name="Country",
    title="The Olympics Story",
)
While this short post tells several stories behind the Summer Olympics, I would like to write a future post on the stories behind Paralympics which will would be stories of courge, inspiration and extraordinary commitment.
The data used here is from a Kaggle dataset. This Kaggle dataset was also used to get NOC (National Olympic Committee) codes of the different countries. Some of the numbers in the dataset does not seem to agree with tables in Wikipedia, nevertheless the differences are not huge to change the story.
-
More Software and Silicon than Steel →
Automakers are in the news lately, not for the the usual reasons like launching fully electric models of their vehicles, or factory closures or emission scandals. They are in the news because of semiconductor shortage, throwing many into a state of shock. For people following the auto industry this is only as common as Apple, Qualcomm or AMD’s woes.
The rise of the ECUs For more than a decade now, there has been more and more software and silicon that go into automobiles than steel. A typical automobile has about a couple of hundred Electronic Control Units (ECUs) which are microcontrollers each receiving inputs from different (like tire pressure, oil, seat belt, engine temperature, etc.) and producing outputs that translate to action (like a dashboard indicator light on low tire pressure, etc.). Since the cost of sensors have been going down rapidly, more and more of them are added in today’s vehicles and hence more ECUs to process them. The software that goes along is also tightly coupled with the hardware and these ECUs are bought from different OEMs. Much like a computer architecture, most of the automakers connect these ECUs through a common bus usually over a Controller Area Network (CAN). The number of ECUs have only been increasing with the number of features. Rain sensors, daylight sensors, blind-spot sensors, parking sensors are all commonplace in today’s vehicles.
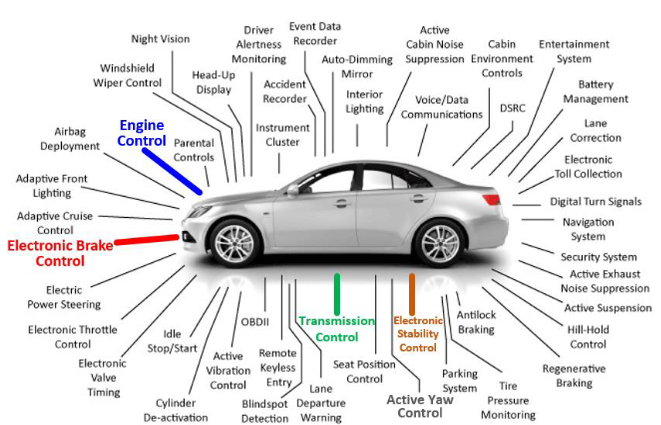
Source: How Computer Science Helps Car Technology - Bruce Yellin
From ECUs to DCUs ECUs constitute a decentralized architecture - each ECU controls a particular function. With the increasing number of ECUs controlling critical functions like ADAS (Advanced Driver Assist Systems), autonomous driving, radars, etc., the industry has been moving to an architecture called DCU (Domain Control Unit) wherein instead of hundreds of ECUs a few DCUs would control multiple functions. This has been enabled by advances in semiconductors (performance and power) over the years and the decreasing cost of sensors. In a sense, DCUs constitute a centralized architecture. Much like how a PC Operating System can make way for high priority tasks, the software enabling the DCUs could prioritize critical functions. Further, this also enables flexibility and extensibility. The hardware (sensors and processing power) would remain in the vehicle and new software when installed would provide a new feature, much like how you have a CPU and memory (hardware) in your laptop and you can install Microsoft Office (software) if and when needed. From CAN, the automobiles are trying to move on to ethernet based architecture for many of the functionalities because of the faster transmission speed and more data per frame. CAN provides predictable and collision-free network access between nodes.
Into the Future With advanced sensors (like cameras and lidar) providing streaming, high resolution data, the processing power of the hardware needs to be beefed up in order to process them in real-time. This has enabled the makers of high performance processors to enter the market to compete with the many ECU vendors. NVIDIA and Intel are two of the major processor makers that are making their presence felt in the automotive space, besides Qualcomm and others. With hardware being the muscle, more and more value would be added by innovation in software (the mind). For example, a camera might just send frames of a snowy scene which software could then process, along with some real-time data it receives from neibouring vehicles or cellular phone towers, etc. and create an actionable insight for the actuators. Software can use the historical data from the vehicle for diagnosis and more importantly prognosis of faults. With the decreasing cost of sensors the data collected will explode in volume over time and the automotive software stack might also include a cloud component to store data for continuous processing.
As the importance of electronics and software has grown, so has complexity. Take the exploding number of software lines of code (SLOC) contained in modern cars as an example. In 2010, some vehicles had about ten million SLOC; by 2016, this expanded by a factor of 15, to roughly 150 million lines. Snowballing complexity is causing significant software-related quality issues, as evidenced by millions of recent vehicle recalls - McKinsey & Co.
With most vehicles made of steel and aluminium the value differentiator was brought about by the (electronic) features over the past decade. The next decade would usher in a new era of value differentiation enabled by software innovations. Who would own the hardware and operating system (much like Windows and Intel or Android and ARM in PC and mobile generation) of the era of automobile innovation is yet to be seen.
We really designed the Model S to be a very sophisticated computer on wheels – Elon Musk, 2015