Is it GameStop vs Hedge Funds or GameStop vs Streaming? →
Everyone knows GameStop now, and its ticker symbol too - gamers, non-gamers, traders, non-traders, all alike.
GameStop is a chain of retail stores that sells game merchandise, equipment and at one point (when games were sold on CDs) games. Retail is moving online and if the product is software, it has already moved. I can’t recollect the last time I saw Windows OS or Office sold in a CD.
Hedge funds apparently make money by betting on such companies - borrow money or company shares from some lender promising to repay and in the mean time, bet on the downside of the company, wait for the price to crash, buy the stock (for cheap) and give it back to the lender (pocketing the difference). I am not sure how they pick companies to bet on. However, late last year and early January, GameStop was the candidate. In order to revolt againt this, some online enthusiasts mobilized themselves to buy options on this stock, thereby increasing the stock price (‘stock price’ not ‘company value’) that would hurt the Hedge funds’ intentions.
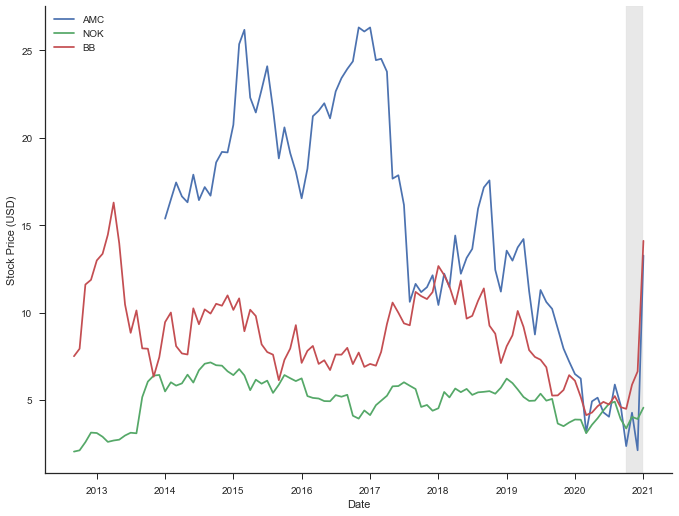
Let us look at some data to see if Hedge funds are the real detterants to GameStop’s future or if there are other factors - like streaming. It was not just GameStop (GME), but also Nokia (NOK), AMC and Blackberry (BB) that went through this early January, but GameStop had the biggest change. Just to show the trend in these stocks (GameStop removed from the plot below as the change in GME was too high that the other trends wouldn’t show up well). Notice how the overall trend in stock prices have been over the last few years and how it changed towards the end of 2020 and early 2021.
...
plt.plot(amc_df['Date'], amc_df['Adj Close'], label='AMC')
plt.plot(nok_df['Date'], nok_df['Adj Close'], label='NOK')
plt.plot(bb_df['Date'], bb_df['Adj Close'], label='BB')
plt.plot()
...
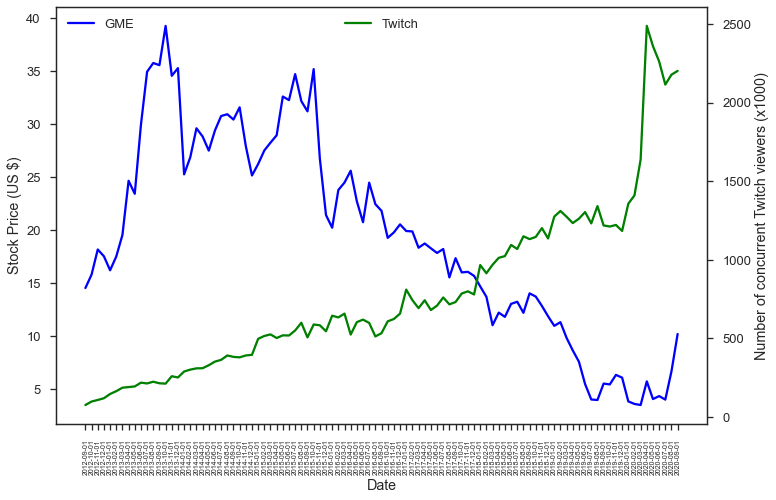
In order to see what (game) streaming industry is like, I started looking for data on this - number of subscribers, streamers, etc. I found Twitchtracker that tracks statistics on Twitch. Since Twitch’s data was easiest to get and well organized, I decided to look at just Twitch data (number of concurrent viewers) and plot it alongside GameStop stock price over the years.
fig, ax1 = plt.subplots()
ax2 = ax1.twinx()
line1, = ax1.plot(gme_df['month'], gme_df['Adj Close'], color='blue')
line2, = ax2.plot(twitch_df['month'], twitch_df['avg_concurrent_viewers']//1000, color='green')
...
plt.show()
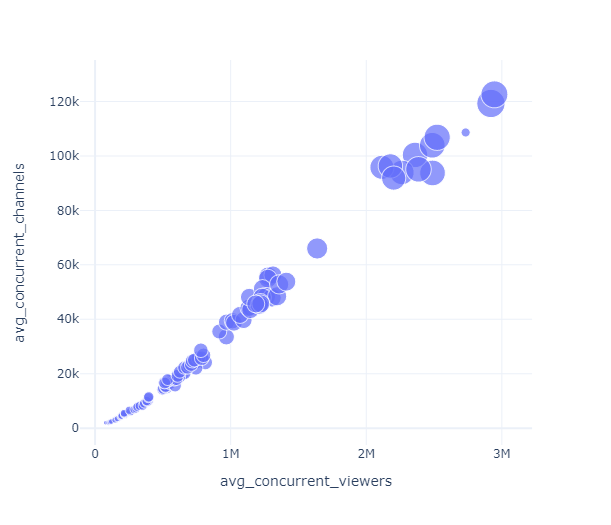
The number of Twitch channels also keep increasing along with the number of viewers and this trend is only likely to continue during these pandemic times.
fig = px.scatter(df, x='avg_concurrent_viewers',
                     y='avg_concurrent_channels',
                     size='time_watched')
fig.show()
On the other hand many retail stores like GameStop’s were hit hard during the pandemic.
Everyone can infer the trend in the industry. Hedge funds are disliked for several reasons, some of them valid. But the future of gaming is online and if GameStop were to survive, it has to build that future than anchor itself in its glorious past.
The data from Twitchtracker was parsed using BeautifulSoup, and the plots were done using matplotlib, seaborn and plotly.